Cadence
Develop-to-core execution, staged delivery, stabilized Sun Belt rental income
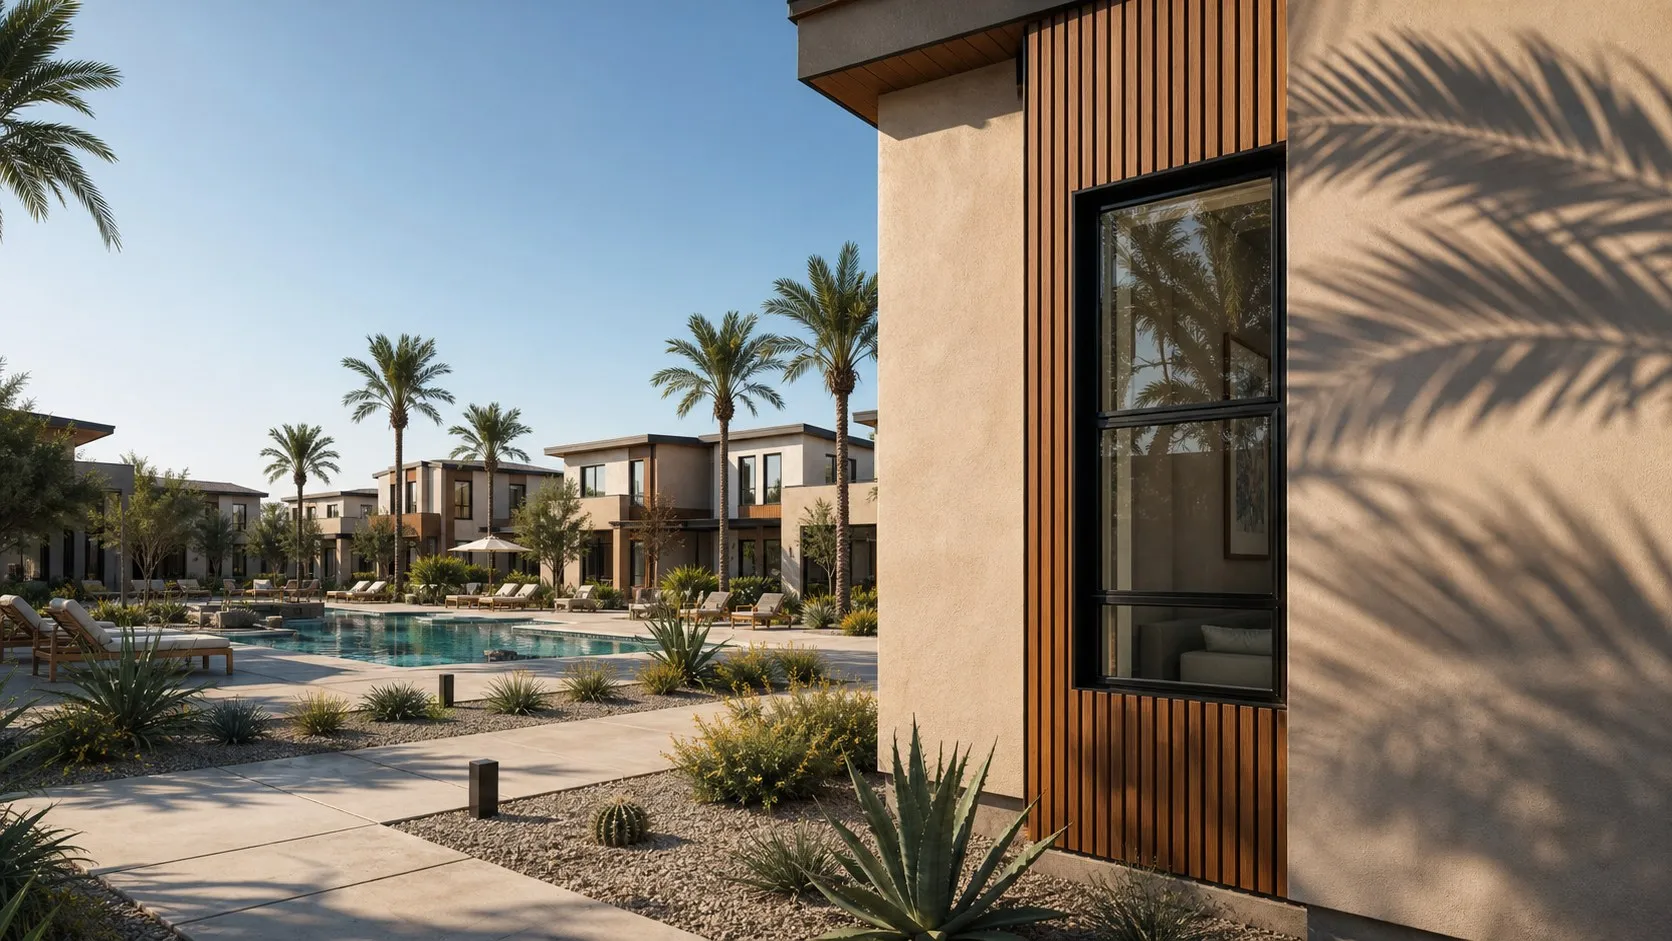
Develop-to-core execution, staged delivery, stabilized Sun Belt rental income
260 homes of detached and townhome rental in a supply-short Sun Belt submarket. Stabilized NOI of $5.62M at a 6.55% yield on cost against a 5.0% exit cap. Built at 60% loan to cost with $34.0M of LP equity. A 155 basis point development spread.
Returns depend on delivering lease-up to about 94% occupancy on schedule. Construction cost and timing risk during the build. A single-asset, single-market position. Refinance proceeds of about $8.0M rely on rates and cap rates at stabilization.
Sun Belt in-migration and job growth feeding household formation. A shortage of family-sized rental with yards. Renters priced out of for-sale ownership. Institutional demand for stabilized build-to-rent as core income.
New apartment and build-to-rent supply competing for renters. Cap rate expansion at exit. Rent growth slowing in a softer cycle. Rising insurance, tax and operating costs across the Sun Belt.
Moderate. New build-to-rent and apartment supply can enter the Phoenix submarket, but land, entitlement and construction timelines limit near-term additions. Cadence delivers into current demand ahead of much of the pipeline.
Low to moderate. Construction labor and materials pricing sits with the general contractor and trades. A guaranteed-price contract and a 5% contingency hold cost risk inside the $85.75M budget.
Moderate. Class A apartments and other rental communities compete for the same renters, but few offer detached homes with yards and garages at this rent.
Moderate. Renters can choose apartments or other communities, but family-sized rental with yards is scarce, which supports rent and holds occupancy near 94%.
Moderate. For-sale ownership is the main substitute, but high mortgage rates and home prices keep many households renting. Older garden apartments compete on price, not on product.
Arizona is a pro-growth state with stable property and land-use policy. Local zoning for build-to-rent is established across the Phoenix suburbs. Arizona has no rent control, and the leasing framework is landlord-neutral.
Phoenix has led the Sun Belt on job and population growth. Household incomes support blended rents near $2,925 per month. Interest rates set the cost of the construction and permanent debt and the exit cap rate.
In-migration and household formation drive rental demand. Renters priced out of ownership want space, yards and garages without buying. Build-to-rent meets that preference at a rent below the cost of owning.
Renters search and lease online. Smart-home features, self-guided tours and digital leasing are now standard resident expectations. Property management runs on modern operating platforms and resident portals.
The desert climate raises water and cooling costs, addressed through xeriscaping and efficient construction. Extreme heat is a design consideration. Long-term regional water policy is a watch item for the hold.
Standard Arizona residential landlord-tenant law governs the leases. Building codes, impact fees and permitting apply through construction. Fair-housing rules apply in leasing and marketing.
General contractor and trades, the construction and permanent lenders, the property management partner, the land seller and local government.
Development and construction, lease-up and marketing, property management, resident retention, and financing across construction and permanent debt.
New detached and townhome rental with yards and garages, at a rent below the cost of ownership, in a supply-short Sun Belt suburb.
Professional on-site management, digital leasing, resident services and renewals across the hold.
Families and households priced out of ownership who want space, yards and garages across suburban Phoenix.
The 260-home site, the completed community, the amenity core and the operating platform.
On-site leasing office, listing sites, digital marketing, resident referrals and the management team.
Land and construction, financing cost, property operating expenses, management fees and general and administrative.
Residential rent across 260 homes, plus other income from parking, pets, deposits and ancillary fees.
Families in suburban Phoenix are priced out of ownership, and there is little new rental with yards and garages. Apartments offer no private outdoor space. Older rentals are dated and unevenly managed.
A 260-home community of new detached cottages and townhomes with yards and garages, around a pool and clubhouse, professionally managed and held for income.
New family-sized rental with private yards and garages, at a rent below the cost of ownership.
A secured 260-home site, scale that single-home landlords cannot match, and a purpose-built operating platform.
Families and households priced out of ownership who want space, yards and garages across suburban Phoenix.
Occupancy, net operating income, yield on cost, debt service coverage and cash-on-cash return.
On-site leasing office, listing sites, digital marketing and resident referrals.
Land and construction, financing cost, operating expenses, management fees and G&A.
Residential rent across 260 homes at a blended $2,925 per month, plus parking, pet and ancillary income.
Single-asset entity, a clear LP and GP structure, construction and permanent debt facilities, audited budgets and quarterly LP reporting.
Development manager, the construction team, property management staff, leasing agents and a finance lead.
Property management and leasing software, a resident portal, smart-home features, and online tour and application tools.
Land, the general contract, materials and trades, insurance, and financing across construction and permanent debt.
Land acquisition, entitlement, site work and delivery of materials to the construction site.
Vertical construction of 260 homes and the amenity core, then day-to-day property management and maintenance.
Home turnover, move-in and occupancy under signed leases held for income.
Pre-leasing, listing sites, digital marketing, model homes, the leasing office and resident referrals.
Maintenance, resident services, renewals and retention across the hold.
Cadence: new detached and townhome rentals with yards and garages, professionally managed, at a rent below the cost of ownership in the submarket.
New Class A apartments: strong amenities and management, but no private yards or garages, on a smaller footprint at rents at or above Cadence.
Scattered single-family rentals from small landlords: private homes, but inconsistent quality, no amenity core and uneven management.
Older garden apartments: lower rents, but dated product, no yards and higher turnover at this stage of the cycle.
When my family needs more space than an apartment, I want a house with a yard and a garage that I can rent without having to buy.
When I rent a home, I want it to feel settled and safe and professionally managed, so I can put down roots without the cost of ownership.
When neighbors and friends see where I live, I want a real home in a well-kept community, not a unit in a large apartment block.
No new rental with yards. High home prices and mortgage rates. Cramped apartments. Dated older rentals. Inconsistent small-landlord management.
A new home with a yard and garage. A pool and clubhouse. Professional management. Flexible leasing. A quiet, well-kept neighborhood.
Renting an apartment. Renting an older single-family home. Buying at today's prices and rates. Staying put in a smaller place.
6.55% yield on cost, stabilized NOI of $5.62M against $85.75M of total development cost. A 155 basis point spread over the 5.0% exit cap rate.
Stabilized NOI of $5.62M from 260 homes at a blended $2,925 per month, after 6% vacancy and credit loss and a 37% operating expense ratio.
1.35x debt service coverage on the $59.4M permanent loan at stabilization. A conservative sizing that supports the refinance and the distributions.
5.5% stabilized cash-on-cash to equity. Quarterly distributions once stabilized, paid after debt service.
A 63% NOI margin on effective gross income. Operating expenses run at 37%, in line with stabilized Sun Belt build-to-rent.
About 94% stabilized occupancy, held by a shortage of family-sized rental with yards. Renewals and retention keep turnover low.
Lease up the 260 homes to about 94% occupancy and hold rents at the blended $2,925 per month plan for the Phoenix submarket.
Add resident services, renewals and ancillary income across the existing community to lift NOI without new construction.
Apply the same build-to-rent model to further Sun Belt sites once Cadence stabilizes and refinances.
Add adjacent product types such as age-targeted or larger-home rental communities in new markets.
| Criterion | Assessment |
|---|---|
| Valuable | 260 new homes with yards and garages meet real demand in a supply-short submarket. Stabilized NOI of $5.62M at a 6.55% yield on cost. Each home leases at a rent below the cost of ownership. |
| Rare | New family-sized rental at scale is scarce in the Phoenix suburbs. Few communities pair detached homes and townhomes with yards, garages and a full amenity core at this rent. |
| Inimitable | Strong. A single home is easy to rent, but a 260-home site, entitlement and a built community cannot be assembled inside a short window as new supply and land tighten. |
| Organized | Yes. Built at 60% loan to cost with $34.0M of LP equity, a professional management platform, and a develop-to-core plan that refinances to $59.4M of permanent debt. |
Cap rate expansion at exit or a sharp rate move at refinance. Watch through quarterly valuation and rate reviews, with a permanent loan sized conservatively at 1.35x coverage.
Construction cost and timing, and the pace of lease-up to about 94% occupancy. Mitigate through a guaranteed-price contract, a 5% contingency, phased delivery and pre-leasing ahead of turnover.
Minor swings in rent and month-to-month occupancy. Accept these and hold them within the operating budget.
Rising insurance, tax and operating costs, and normal resident turnover. Manage through the management platform, renewals and annual budget reviews.