Cadence returns capital at about a 16 percent net IRR over a five-year hold
~16%
LP net IRR
After 8% pref and 30% promote
1.95x
LP equity multiple
Net to limited partners
5.5%
Stabilised cash-on-cash
Cash yield after refinance
5 yrs
Hold period
Build, stabilise, then exit
The plan builds at 60 percent loan to cost, stabilises the community, refinances into permanent debt, and holds for income. The return comes from a yield on cost above the exit cap, not from cap rate compression.
Dashboard · 03
The raise is $34.0M of LP equity into an $85.75M project
$34.0M
LP equity
Limited partner commitment
$85.75M
Total development cost
Land, build, fees, reserves
$51.45M
Construction loan
Senior debt through delivery
60%
Loan to cost
GP co-invests $0.3M alongside
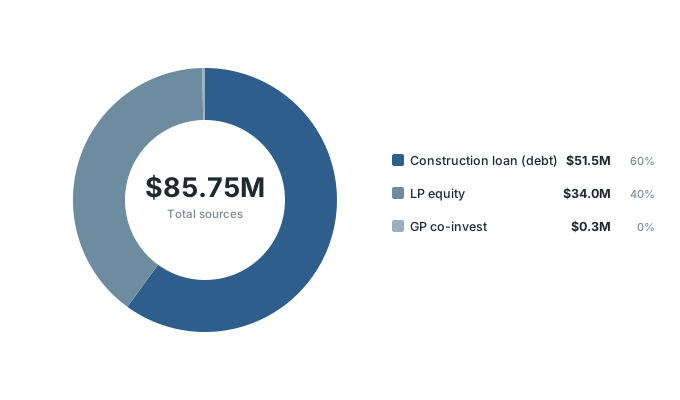
LP equity funds the gap between total cost and the construction loan. The general partner co-invests $0.3M, so total equity is $34.3M and the sponsor is aligned with limited partners from day one.
Dashboard · 04
Stabilised net operating income of $5.62M supports a $112.4M value
$5.62M
Stabilised NOI
Year-three run rate
$112.4M
Stabilised value
At a 5.0% exit cap rate
5.0%
Exit cap rate
Applied to stabilised NOI
$85.75M
Total cost basis
All-in development cost
5-year forecast — S$ M (annual)
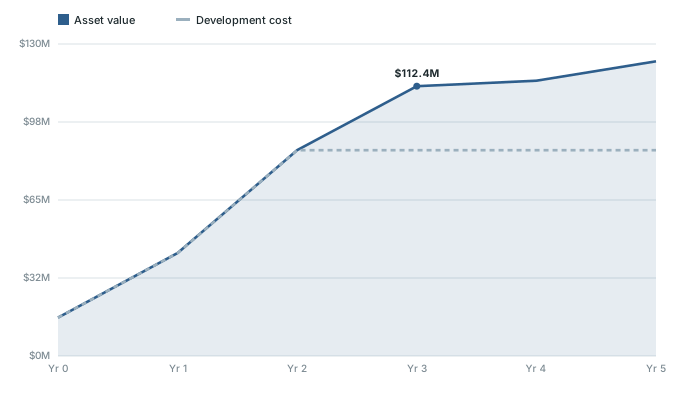
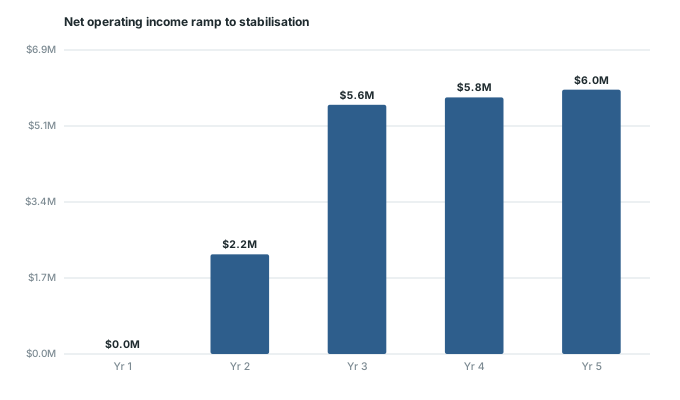
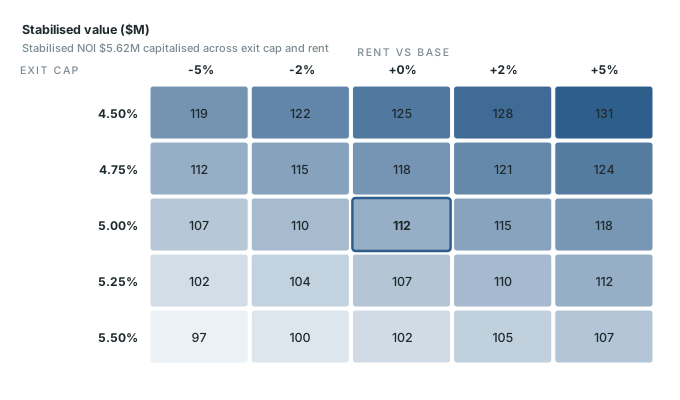
The community reaches a stabilised NOI of $5.62M. Valued at a 5.0 percent cap rate, that is $112.4M, roughly $26.7M above the $85.75M cost basis.
Dashboard · 05
Yield on cost of 6.55 percent sits 155 basis points above the exit cap
6.55%
Yield on cost
Stabilised NOI over total cost
5.0%
Exit cap rate
Market cap for stabilised BTR
155 bps
Development spread
Yield on cost less exit cap
$26.7M
Value over cost
$112.4M value on $85.75M cost
Monthly clients — 24 months
Registered base — annual
Building to a 6.55 percent yield on cost and valuing at a 5.0 percent cap is a 155 basis point spread. That spread is the margin between cost and stabilised value, and it is where the equity return is earned.
Dashboard · 06
260 homes across four floor plans at a blended rent of $2,925 a month
260
Homes
Cottages and townhomes
$2,925
Blended rent
Per home, per month
4
Floor plans
One to three bedrooms
~1,140 sqft
Average home size
720 to 1,750 square feet
Revenue by category — 24 months
Revenue by category — annual
The mix runs from 720 square foot one-bed cottages at $2,095 to 1,750 square foot detached homes at $3,995. Family-sized rentals with yards and garages carry the premium rents and hold occupancy.
Dashboard · 07
Gross rent of $9.13M flows to $5.62M of net operating income
$9.13M
Gross potential rent
Plus $0.37M other income
$8.92M
Effective gross income
After 6% vacancy and credit
$3.30M
Operating expenses
37% of effective gross income
$5.62M
Net operating income
Stabilised, before debt service
From $9.13M of gross rent plus $0.37M of other income, a 6 percent vacancy allowance and a 37 percent expense ratio leave $5.62M of NOI. The expense load reflects single-family maintenance across a spread-out community.
Dashboard · 08
Total development cost of $85.75M, from land to lease-up reserve
$85.75M
Total development cost
All-in, land to stabilisation
$53.0M
Hard construction
Vertical and horizontal build
$16.0M
Land
Entitled site acquisition
$2.65M
Contingency
5% of hard cost
Cumulative gross profit — 24m
Gross profit & margin — annual
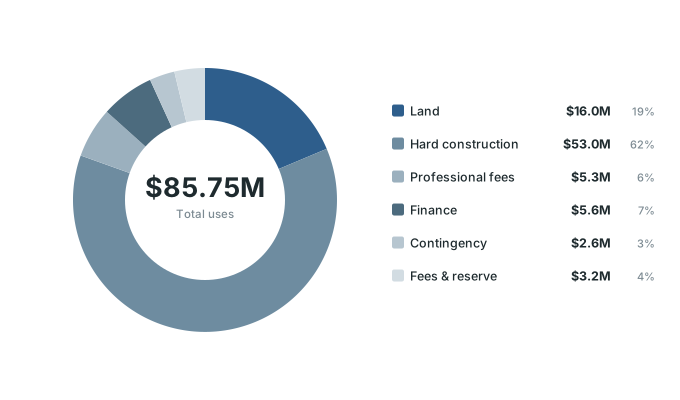
Hard construction is the largest line at $53.0M, with land at $16.0M. Professional fees of $5.3M and finance of $5.6M sit alongside $3.2M of impact fees and reserves to complete the $85.75M basis.
Dashboard · 09
Permanent debt of $59.4M is sized to a 1.35 times debt service cover
$51.45M
Construction loan
60% of total cost
$59.4M
Permanent loan
Refinanced at stabilisation
1.35x
Debt service coverage
NOI over annual debt service
$8.0M
Cash-out to equity
Released on refinance
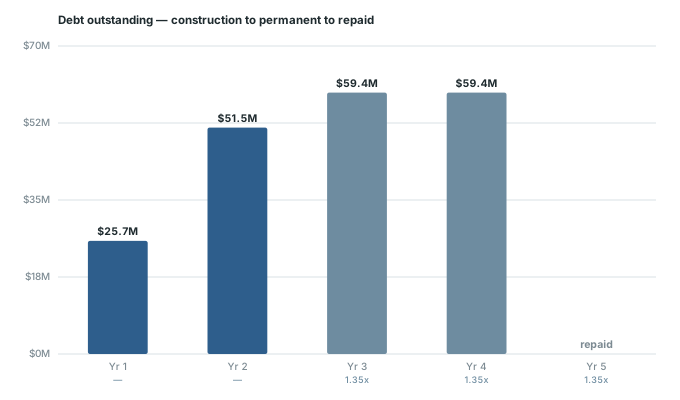
The construction loan funds 60 percent of cost. At stabilisation it refinances into a $59.4M permanent loan sized to a 1.35 times cover, releasing about $8.0M back to equity while debt service stays comfortably covered.
Dashboard · 10
An LP net IRR near 16 percent and a 1.95 times equity multiple
~16%
LP net IRR
After pref and promote
1.95x
LP equity multiple
Net to limited partners
5.5%
Stabilised cash-on-cash
Annual cash yield on equity
~19%
Project-level IRR
Before the promote split
Marketing spend — 24 months
Marketing spend — annual
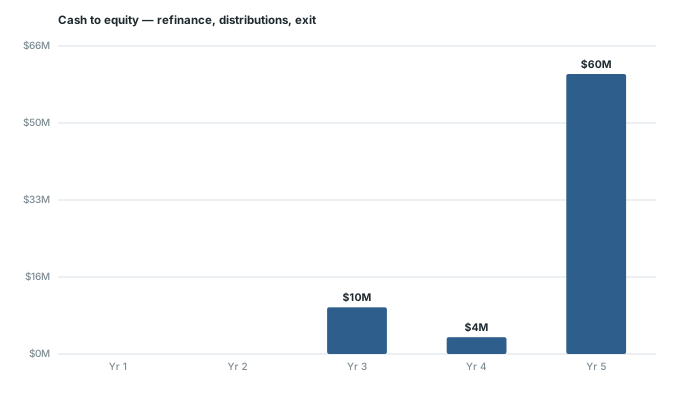
Limited partners receive an 8 percent preferred return, then a 70/30 split above it. Net of the promote, the LP return is about 16 percent IRR and 1.95 times equity, against a project-level IRR near 19 percent.
Dashboard · 11
Build, stabilise, refinance, hold, then exit at the end of year five
Yr 0-1
Site and horizontal
Groundbreak, streets and utilities
Yr 1-2
Vertical construction
Homes delivered in phases, lease-up begins
Yr 2-3
Stabilisation
~94% occupancy, refinance, cash-out
Yr 3-5
Income and exit
Quarterly distributions, exit at year five
Cadence follows a develop-to-core path. Horizontal work and first verticals come first, homes deliver and lease in phases, occupancy stabilises near 94 percent, and the project refinances before settling into income through a year-five exit.
Dashboard · 12
Lease-up to about 94 percent stabilised occupancy
~94%
Stabilised occupancy
Physical occupancy at stabilisation
6%
Vacancy and credit
Underwritten allowance
260
Homes to absorb
Leased across delivery phases
$2,925
Blended rent
Per home at stabilisation
Overheads — 24 months
Overheads — annual
Homes lease as they deliver, so absorption spreads across the build rather than landing all at once. Underwriting holds a 6 percent vacancy and credit allowance and reaches stabilised occupancy near 94 percent.
Dashboard · 13
The plan holds debt cover down to about 79 percent occupancy
1.35x
Debt service cover
Headroom over a 1.0 times floor
~79%
Break-even occupancy
Where NOI covers debt and opex
155 bps
Development spread
Margin absorbing cap rate moves
5.0%
Exit cap assumption
A 50 bps rise trims value, not the return
The main risks are cap rate and rent. A 1.35 times cover holds debt service to about 79 percent occupancy, and the 155 basis point development spread absorbs a modest rise in the exit cap before returns are impaired.
Dashboard · 14
Sun Belt demand for family-sized rentals underwrites the hold
260
Family-sized homes
Yards and garages, detached and townhome
$2,925
Blended rent
Below the cost of for-sale ownership
~94%
Stabilised occupancy
BTR holds through cycles
5.0%
Institutional exit cap
Core demand for stabilised BTR
Revenue / employee — annual
Headcount — annual
Salary split — annual
Phoenix draws steady in-migration and job growth, and family-sized rentals with yards are in short supply. Renters priced out of ownership stay longer, which supports occupancy and gives institutional buyers a reason to hold stabilised BTR as core income.