market_report
6.1 Market
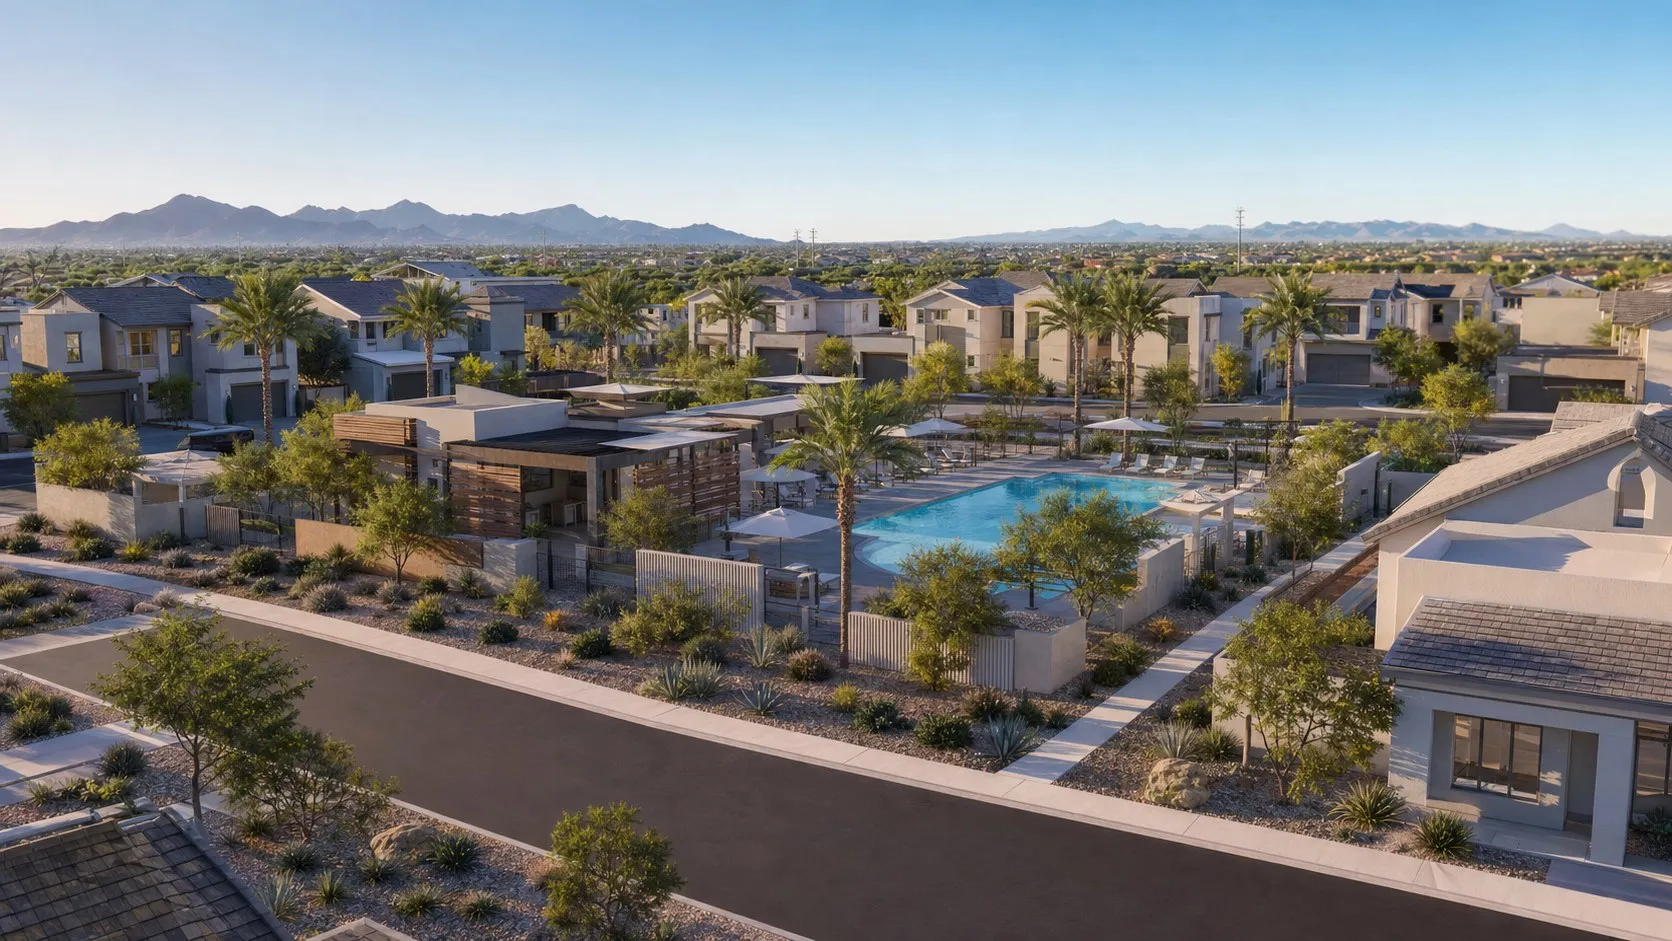
Slide 1 - Cover (LAVisions layout)layout: title_hero · 16:9

Cadence
Market & Demand
Why the Sun Belt, and why rental.
MK 01 / 10
Market opportunity
A metro renter base of 665,000 households and a shortage of family-sized homes to rent
665,000Total renter demand
Renter households across metro Phoenix, growing with in-migration each year
Maricopa County and the surrounding suburban submarkets.
48,000Addressable rental pool
Households seeking a family-sized rental home in Cadence's submarkets
Family renters priced out of buying, the fastest-growing part of the pool.
260Cadence's capture
260 homes leased to about 94% occupancy at a $2,925 blended rent
$5.62M of stabilized net operating income at a 6.55% yield on cost.
MK 02 / 10
Why here, why now
Phoenix demand is structural, not cyclical
01
People keep moving to the Sun Belt
Phoenix keeps drawing residents and employers from higher-cost states. Job and population growth feed steady household formation.
02
Renting for longer
Higher home prices and mortgage rates keep would-be buyers renting. Demand for a house without a purchase keeps building.
03
Institutions want core income
Stabilised build-to-rent has become a core holding for institutional owners. Buyers stay active for well-run communities at a 5.0 percent cap.

MK 03 / 10
Business model
Rental income with a develop-to-core spread
Main income
Blended rent per home
260 homes at a $2,925 blended monthly rent, less 6% vacancy and 37% operating cost, leave $5.62M of net operating income.
Development margin
Development margin
A 6.55% yield on cost against a 5.0% exit cap, a 155 basis point spread inside a $112.4M stabilized value.
MK 04 / 10
Total renter demand
Blended rent of about $2,925 a month across the 260 homes
Bottom-up rent roll, Cadence appraisal 2026
Bottom-up by home type
Gross potential rent = homes x monthly rent x 12, summed across the four home types
Home type by home type across the 260-home community
unit a = number of homes; unit b = leases per home each year; unit c = monthly rent
$9.13M
1 and 2-bed cottages
Homes
160
Leases per year
1
Monthly rent
$2,500
$4.79M
3-bed townhomes
Homes
78
Leases per year
1
Monthly rent
$3,500
$3.28M
3-bed detached
Homes
22
Leases per year
1
Monthly rent
$3,995
$1.05M
MK 05 / 10
Addressable rental pool
48,000
665,000 x 35% x 45% x 70% x 65% = about 48,000 households, the addressable rental pool
Filters applied to demand:
Home type: family-sized detached and townhome rentals only - 35%
concentrates on families that want a house with a yard, not a garden apartment
Geography: the suburban submarkets inside Cadence's catchment - 45%
excludes renter households outside the drive-time catchment of the community
Income: households that qualify at Cadence's rents - 70%
excludes households below the income needed to lease at these rents
Timing: households moving or renewing within the lease-up window - 65%
excludes households not in the market during Cadence's lease-up
MK 06 / 10
Cadence's capture
Our target in 5 years
260
| Year | Metro renters | Submarket renters | Cadence homes | Total |
|---|---|---|---|---|
| Y1 | y1 unit a count | y1 unit b rate | y1 unit c value | y1 total |
| Y2 | y2 unit a count | y2 unit b rate | y2 unit c value | y2 total |
| Y3 | y3 unit a count | y3 unit b rate | y3 unit c value | y3 total |
| Y4 | y4 unit a count | y4 unit b rate | y4 unit c value | y4 total |
| Y5 | y5 unit a count | y5 unit b rate | y5 unit c value | y5 total |
Active users
MK 07 / 10
Demand growthRenter demand growing about 2.5% a year through 2029
U.S. Census Bureau and Cadence appraisal, 2026
Metro Phoenix renter households about 665,000, growing with in-migration | census.gov
A shortage of family-sized rentals across the suburban submarket | Cadence appraisal 2026
Phoenix among the national leaders in net in-migration | census.gov
Suburban build-to-rent rents about $2,925 a month, holding through cycles | Cadence appraisal 2026
MK 08 / 10
Risks and mitigation
Four real risks, and how Cadence manages each
Lease-up pace
If leasing runs slower than plan, income arrives later and early distributions compress.
Phased delivery keeps leasing in step with completions, and a lease-up reserve covers a slower ramp.
Construction cost
Hard costs can move over a two-year build and erode the yield on cost.
A 5% contingency and fixed-scope contracts hold the $85.75M budget.
Interest rates at refinance
A higher rate at refinance would size the permanent loan lower and slow the cash-out to equity.
The permanent loan is sized to a 1.35x debt service cover, with headroom if rates rise.
Exit cap rate
An exit wider than a 5.0% cap would lower the sale value at the end of the hold.
The 155 basis point spread between yield on cost and exit cap cushions a softer market.
MK 09 / 10
Key takeaway
Real family-rental demand meeting a thin supply pipeline

Total renter demand
665,000
Addressable rental pool
48,000
Cadence's capture
260
Compound Annual Growth Rate
6.55%

MK 10 / 10